
Facilities of Glass Fiber Preform Characterizations
The state-of-art facilities of Ortac Group allow utilizing the characterization tools of glass fiber preforms including Optical Microscopy (DIC, Dark and Bright Fields), Polariscope, MOPS®, Preform Analyzer and Wavelength Dispersive X-ray Spectrometer (WDS attached to Scanning Electron Microscopy (SEM)). Additionally, Ortac group also utilize the spectroscopic techniques such as Photoluminescence (PL) Spectroscopy, Photoluminescence Excitation (PLE) Spectroscopy, UV-VIS-NIR Absorption Spectroscopy, lifetime measurements, Fourier-Transform Infrared (FTIR) Spectroscopy, Confocal Raman Spectroscopy and X-ray Photoelectron Spectroscopy (XPS). The main tools, which are Polariscope, MOPS®, Preform Analyzer and WDS, are briefly introduced here:
1. Polariscope
Polariscope (purchased from Optacore ®) as a first quality check is utilized just after glass fiber preform production. Bubbles, defects, inclusions, inhomogeneities doping and/or other impurities can be detected along the preform. Preforms are fixed from one side in order to locate it between two crossed polarization filters. These polarization filters are attached to a slider so that the defects can be detected all along the preform. A white light obtained from a halogen lamp is directed longitudinally to help form a minute defects present in the preform. There is one magnifying lens to and a ruler to record the position of the defect. On the other hand, due to using two polarization filters, the polarization of the light transmitted from the magnifying lens can be changed which allow us to differentiate the core, the clad and their interface. This can also give an impression on the difference in the doping concentrations in core region of the preform at various locations.
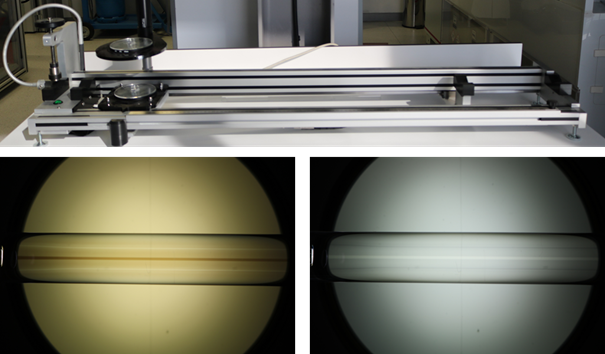
Polariscope and the preform images at two different polarizations
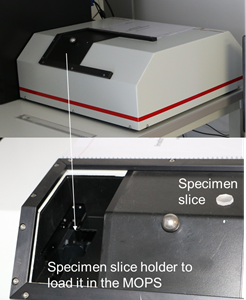
2. MOPS-Yb (Measurement on Preform Slices for Ytterbium)
MOPS is an instrument developed by Optacore to estimate the Yb concentration of a cross-section of a slice cut from the glass preform. The technique is based on the average attenuation of a diode laser light at 976 nm corresponding to a certain amount of Yb+3 ions.
The spot size is made around 100 µm thus a detailed analysis on the Yb distribution can be succeeded.
The slice is placed in a holder which is then inserted inside its unit in the MOPS-Yb. The measurement is completed in a circular direction in the cross-section. Therefore, the number of angles and the diameter of the measurement (circle) is required to start the measurement. For the angles of 20 and 2 mm in diameter, the measurement will be completed less than 20 minutes. In summary, the technique is quite handy for a quick estimation of the distribution of the Yb-concentration within the whole cross-section. The results are shown in the real time and can be ceased at any point.
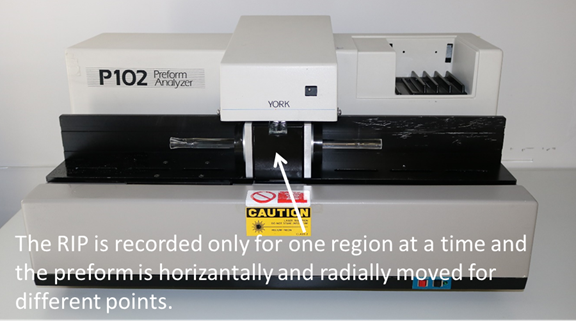
3. Preform Analyzer
The preform analyzer is a device which permits to determine the relative index profile of the preform so that the relative index difference Dn between the core and the clad can be obtained. The locations at various angles can be determined by the user and chosen prior to the measurement. The preform is inserted in the measurement cell in which the preform is manually moved to choose the desired positions. The measurement is based on recording the deflection function. For each measurement, one corresponding deflection function is recorded which is then automatically converted upon choosing the RIP. By this technique, the core size, inner clad size and the numerical aperture (NA from the Dn) of the preform ca be estimated. On the other hand, the defects or inhomogeneities along the preform can also be understood using this technique. Then, the optimum positions of the preform for the fiber drawing are determined.
4. Wavelength Dispersive X-ray Spectroscopy (WDS)
Wavelength Dispersive X-ray Spectroscopy (WDS) is used for the quantitative microanalysis of the radial distribution of the elements present in the polished preform slices. The technique uses the characteristics X-rays formed upon the bombardment of the energetic electrons. Thus, the elemental constituents in the cross-section are determined with a better resolution that energy dispersive X-ray spectroscopy. Furthermore, it allows us to identify the elements typically an order magnitude lower than EDS. This is particularly important since low Yb concentrations can be detected precisely. The spectrum and the results in terms of percentage weight and atomic percentage are reported.
The WDS spectrometer (from Oxford Instrument®) is located inside the High-resolution Electron Microscopy (NOVA NanoSEM, FEI) which is operated within a clean room environment. The spectrometer consisting of multicrystals is capable of changing the crystals on-the-fly. This makes the WDS technique quite user friendly and relatively faster compared to the previous versions. It also allows us to do a quick scan for only one element in the region of interest at a wavelength range. Depending on the chosen element and the range (for the characteristics X-rays), one of four different crystals could be chosen. Using this technique, we can detect elements at very low concentrations (e.g. ppm levels) from light elements such as Beryllium (Be) and Boron (B) to lanthanides including Neodymium (Nd), Erbium (Er) and Ytterbium (Yb). The technique is used first by standardization process which is conducted by the standards whose constitutes are known. This process is repeated for each voltage. Only then, the measurements at various potential and the beam currents can be performed. For example, for light elements, low potentials such as 5 kV at relatively lower beam currents (e.g. 2.5 nA) are chosen to improve the sensitivity of the technique.
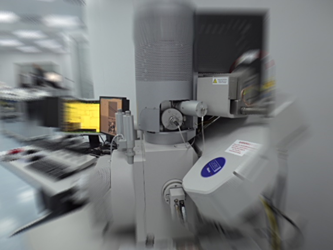
WDS (from Oxford Instruments) spectrometer in NanoSEM